Count Rows on an old rowing machine
Idea
At the end of 2019 a mechanical rowing machine came into my possession. This machine (a Hanseatic Rowing Machine) has no electronics at all but I want to measure the rows I am doing.
Recording
So I bought an I2C based Accelerometer: MMA7455 and soldered a raspberry-pi zero shield for it:
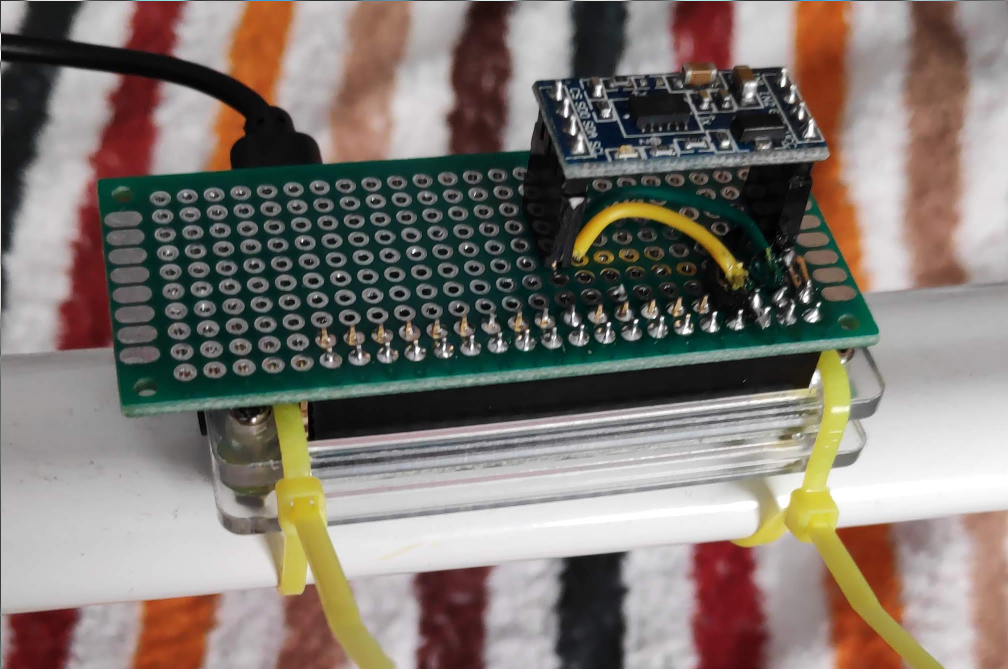
The recording is done with a Python script that is started on boot via systemd.
This code shows howto read the current value from the sensor:
import smbus

bus = smbus.SMBus(1)
# MMA7455L address is 0x1D
bus.write_byte_data(0x1D, 0x16, 0x01)

# read values
data = bus.read_i2c_block_data(0x1D, 0x00, 6)

# Convert the data to 10-bits
xAcc = (data[1] & 0x03) * 256 + data [0]
if xAcc > 511 :
    xAcc -= 1024
yAcc = (data[3] & 0x03) * 256 + data [2]
if yAcc > 511 :
    yAcc -= 1024
zAcc = (data[5] & 0x03) * 256 + data [4]
if zAcc > 511 :
    zAcc -= 1024

print(f"Acceleration {xAcc:5d} {yAcc:5d} {zAcc:5d}")
The full record script used on the raspberry pi is additionally logging to a csv file: https://github.com/mfa/rowing-count/blob/master/record.py.
Evaluation
The latest version of the evaluation as a jupyter notebook: https://github.com/mfa/rowing-count/blob/master/experiments.ipynb
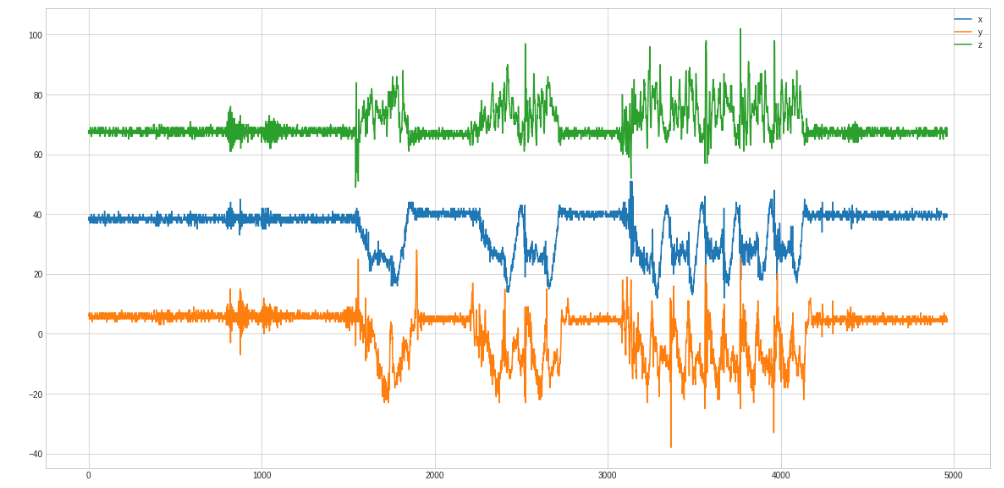
First, we need to find the best curve for the problem. Here we see 1 row, 2 rows and 5 rows:
And only the 5 rows zoomed in:
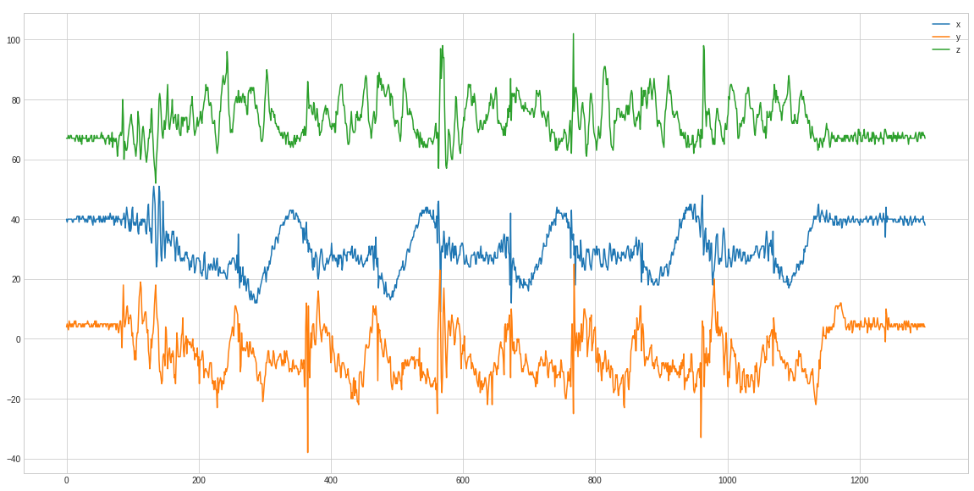
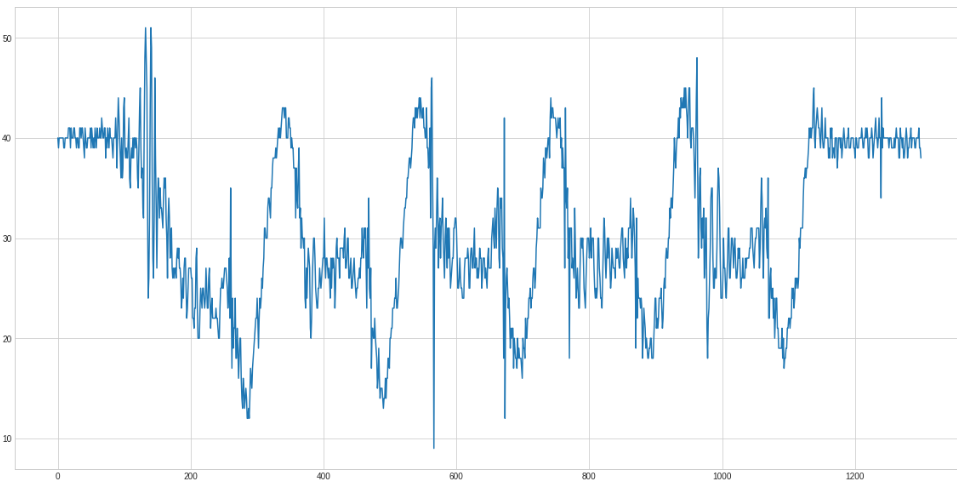
Only in the x axis curve the rows are clearly distinguishable.
So the isolated x axis looks like this
Because it is easier to detect peaks on top we negate the curve:
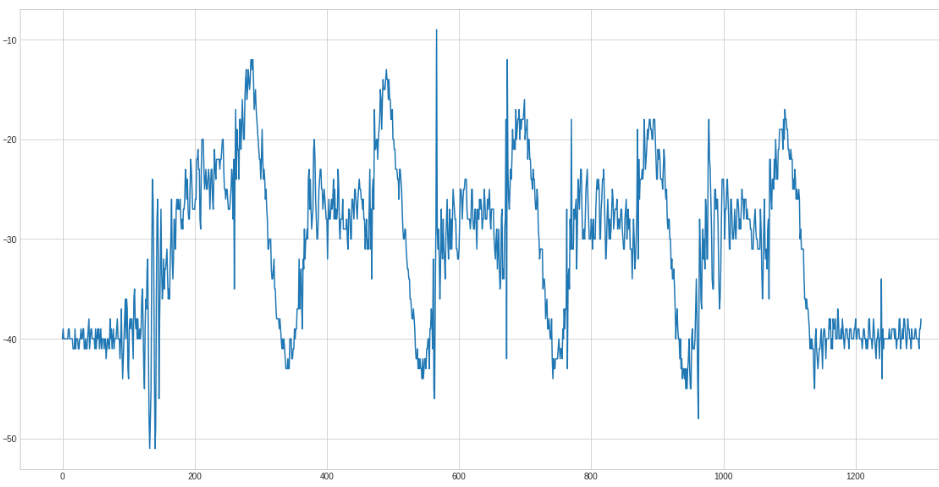
And now smoothen the curve using a savgol filter:
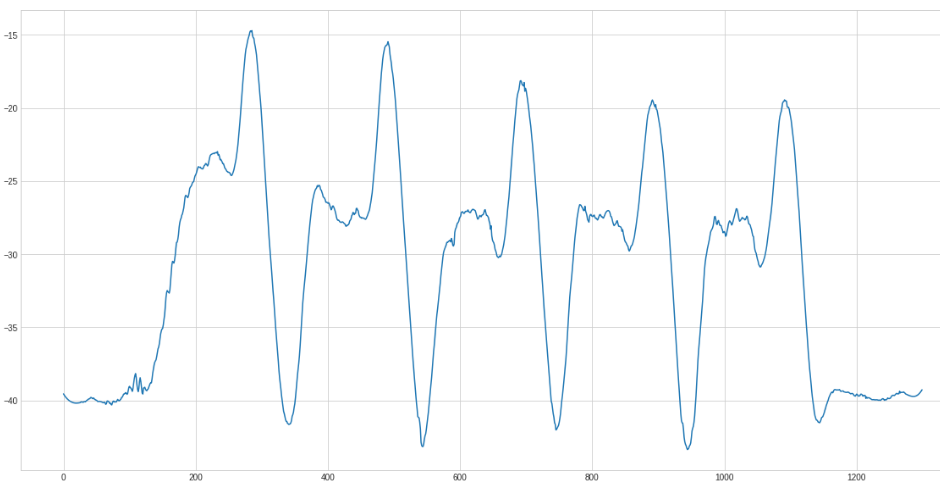
We got the parameters for the savgol by trial and error.
The next step is the peak finding. Scipy has a find_peaks method that works after some tweaking quite good:
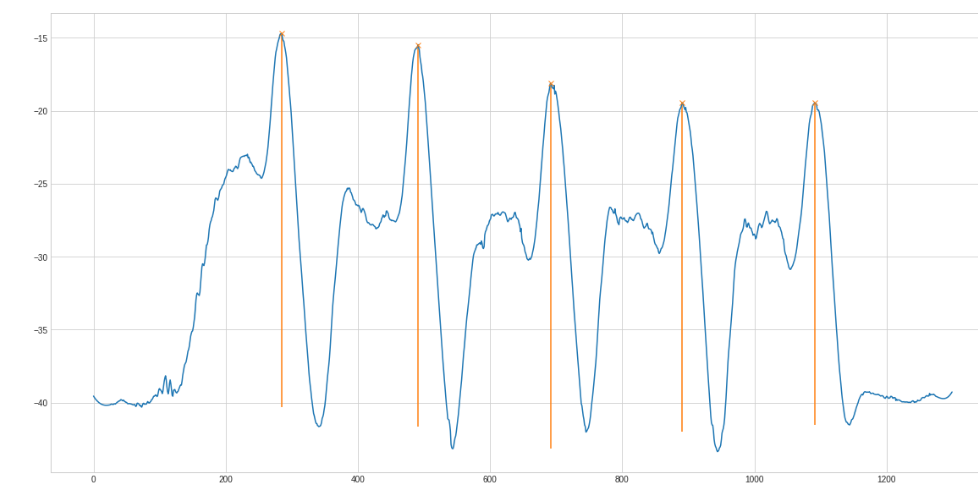
The (orange) line below the found peak is the prominence. This "height" helps filtering too small peaks. The complete filtering methods looks like this
def get_peaks(x):
    _ = np.negative(x)
    _ = scipy.signal.savgol_filter(_, 51, 3)
    peaks, properties = scipy.signal.find_peaks(_, prominence=5, width=40)
    return sum(map(lambda i: i>12, properties["prominences"]))
The sum in the last line filters all peaks with a prominence higher than 12 and only sums them.
Another example with 100 rows:
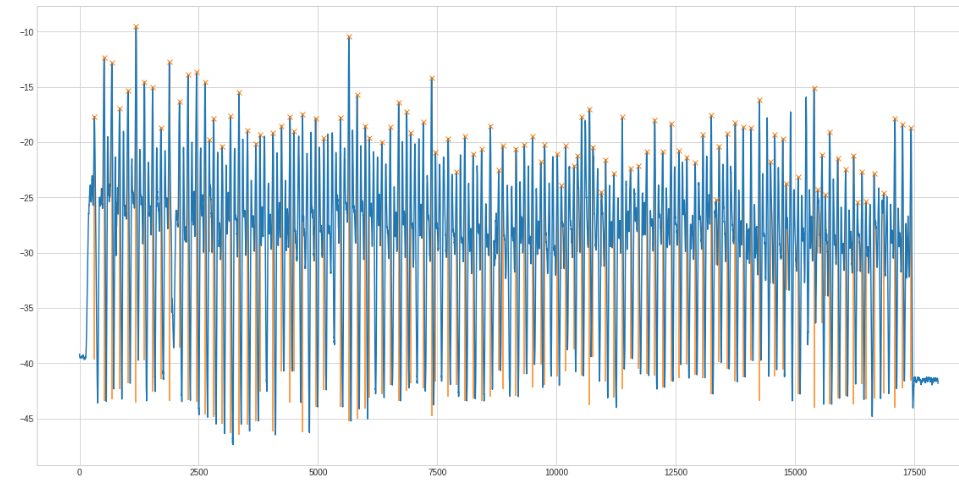
The full code: https://github.com/mfa/rowing-count/