Count Rows on an old rowing machine

Idea

At the end of 2019 a mechanical rowing machine came into my possession. This machine (a Hanseatic Rowing Machine) has no electronics at all but I want to measure the rows I am doing.

Recording

So I bought an I2C based Accelerometer: MMA7455 and soldered a raspberry-pi zero shield for it:

/images/rowing_sensor.png

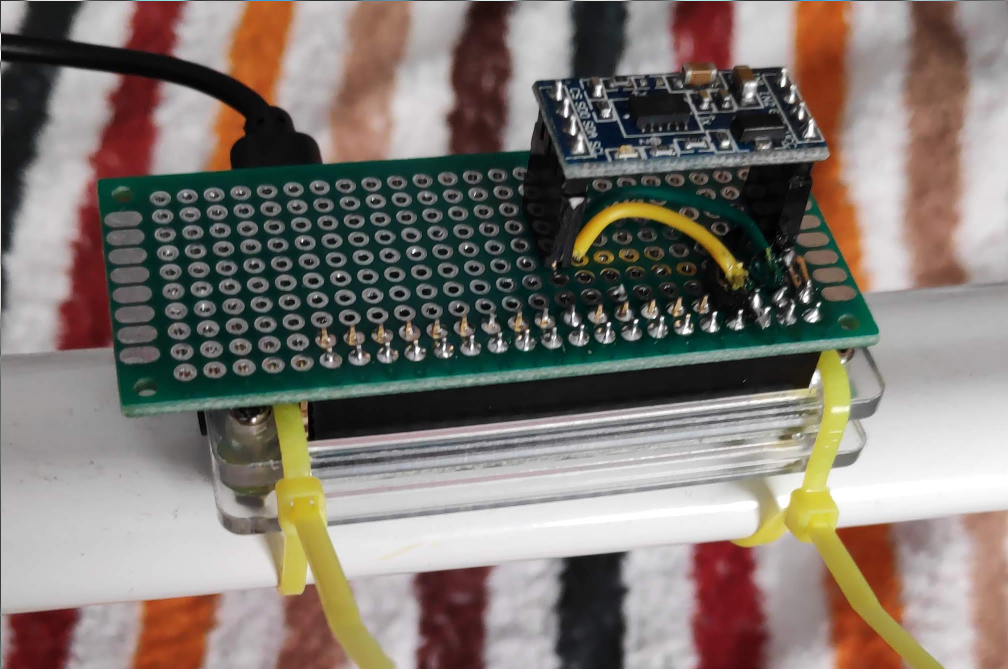
The recording is done with a Python script that is started on boot via systemd.

This code shows howto read the current value from the sensor:

import smbus

bus = smbus.SMBus(1)
# MMA7455L address is 0x1D
bus.write_byte_data(0x1D, 0x16, 0x01)

# read values
data = bus.read_i2c_block_data(0x1D, 0x00, 6)

# Convert the data to 10-bits
xAcc = (data[1] & 0x03) * 256 + data [0]
if xAcc > 511 :
    xAcc -= 1024
yAcc = (data[3] & 0x03) * 256 + data [2]
if yAcc > 511 :
    yAcc -= 1024
zAcc = (data[5] & 0x03) * 256 + data [4]
if zAcc > 511 :
    zAcc -= 1024

print(f"Acceleration {xAcc:5d} {yAcc:5d} {zAcc:5d}")

The full record script used on the raspberry pi is additionally logging to a csv file: https://github.com/mfa/rowing-count/blob/master/record.py.

Evaluation

The latest version of the evaluation as a jupyter notebook: https://github.com/mfa/rowing-count/blob/master/experiments.ipynb

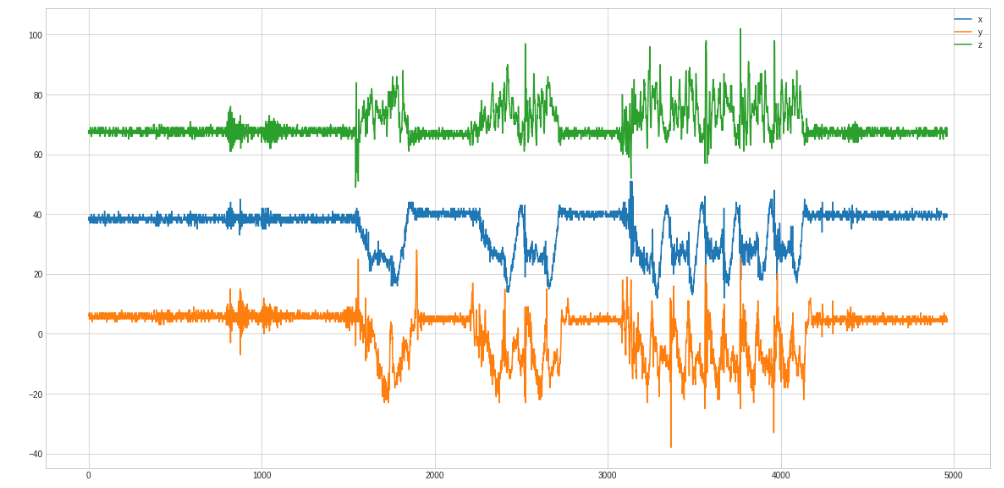
First, we need to find the best curve for the problem. Here we see 1 row, 2 rows and 5 rows:

/images/rowing_all_axes.png

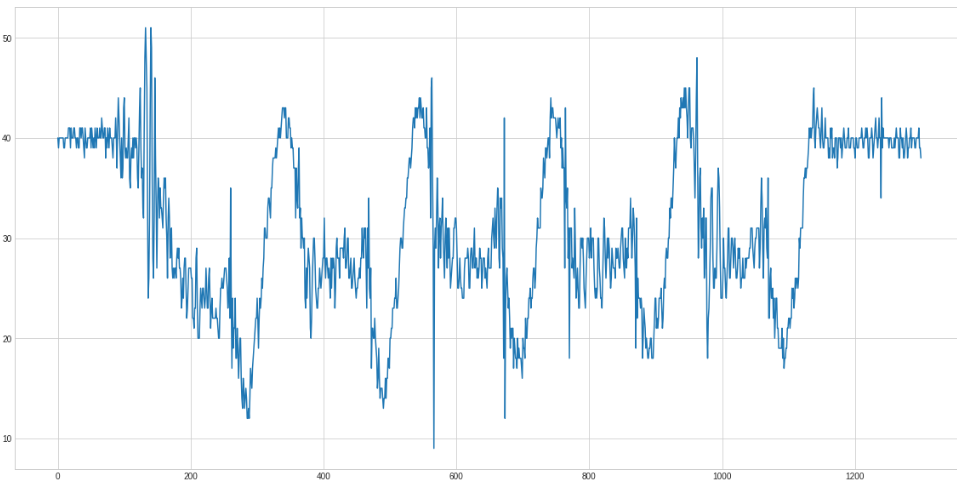
And only the 5 rows zoomed in:

/images/rowing_all_axes_5.png

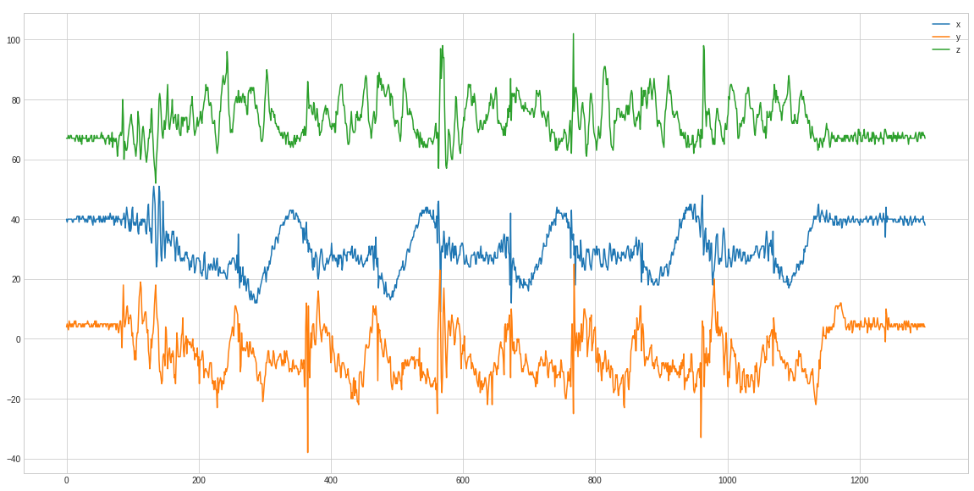
Only in the x axis curve the rows are clearly distinguishable.

So the isolated x axis looks like this

/images/rowing_5x.png

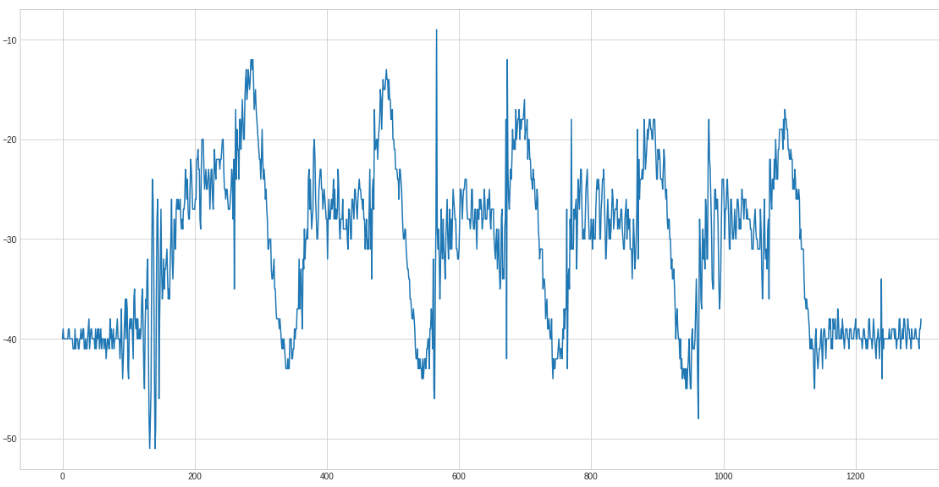
Because it is easier to detect peaks on top we negate the curve:

/images/rowing_5x_neg.png

And now smoothen the curve using a savgol filter:

/images/rowing_5x_neg_savgol.png

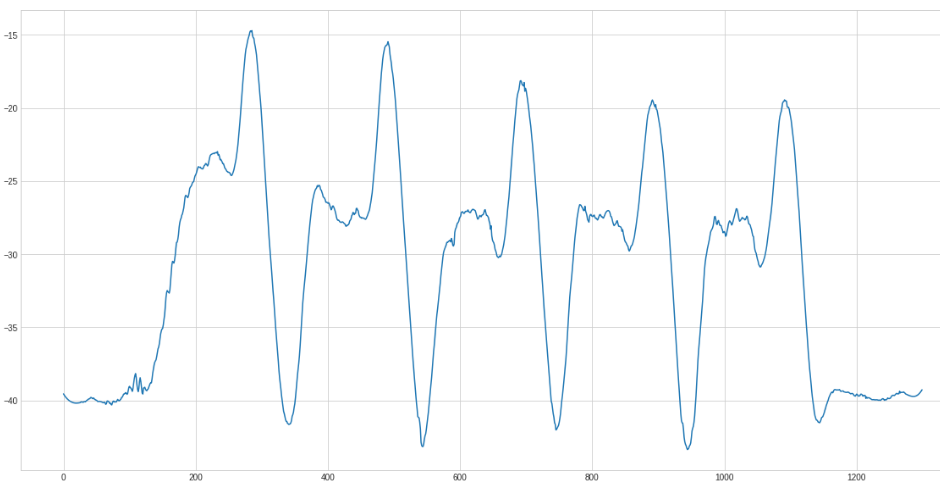
We got the parameters for the savgol by trial and error.

The next step is the peak finding. Scipy has a find_peaks method that works after some tweaking quite good:

/images/rowing_5.png

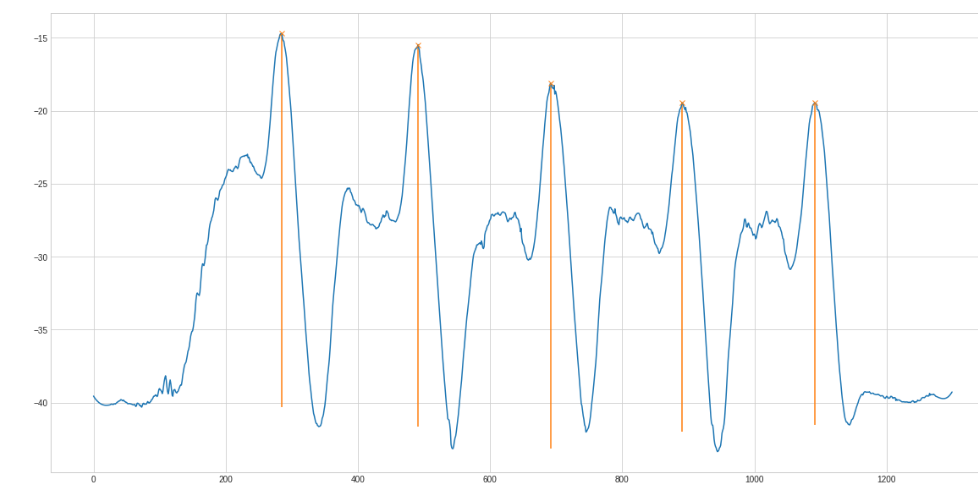
The (orange) line below the found peak is the prominence. This "height" helps filtering too small peaks. The complete filtering methods looks like this

def get_peaks(x):
    _ = np.negative(x)
    _ = scipy.signal.savgol_filter(_, 51, 3)
    peaks, properties = scipy.signal.find_peaks(_, prominence=5, width=40)
    return sum(map(lambda i: i>12, properties["prominences"]))

The sum in the last line filters all peaks with a prominence higher than 12 and only sums them.

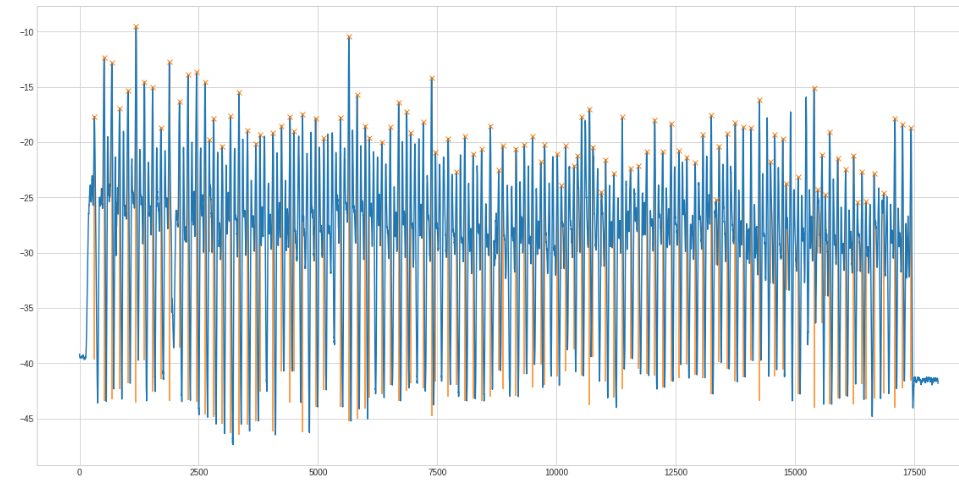
Another example with 100 rows:

/images/rowing_100.png

The full code: https://github.com/mfa/rowing-count/

Use I2C on raspberry pi with archlinux-arm

For Raspbian there is raspi-config to enable i2c on a raspberry pi. On a system without raspi-config (or if you want to enable i2c on the image before boot) the changes are pretty simple.

The two things raspi-config is changing are:

  • Adding one line to /boot/config.txt:

dtparam=i2c_arm=on
  • Adding one line to /etc/modules-load.d/raspberrypi.conf:

i2c-dev

To get the config and module loaded a reboot of the raspberry pi is necessary.

Then you will probably want to install i2c-tools. For example on archlinux-arm:

pacman -S i2c-tools

And search for i2c sensors plugged in:

i2cdetect -y 1

This could look like this:

     0  1  2  3  4  5  6  7  8  9  a  b  c  d  e  f
00:          -- -- -- -- -- -- -- -- -- -- -- -- --
10: -- -- -- -- -- -- -- -- -- -- -- -- -- -- -- --
20: -- -- -- -- -- -- -- -- -- -- -- -- -- -- -- --
30: -- -- -- -- -- -- -- -- -- -- -- -- -- -- -- --
40: -- -- -- -- -- -- -- -- 48 -- -- -- -- -- -- --
50: -- -- -- -- -- -- -- -- -- -- -- -- -- -- -- --
60: -- -- -- -- -- -- -- -- -- -- -- -- -- -- -- --
70: -- -- -- -- -- -- 76 77

The sensors shown here are: ADS1015 (0x48), BME280 (0x76), and BMP180 (0x77).

MNIST with binary color

A few days ago in our local machine learning user group we discussed the decrease of color in MNIST and the possible decrease in accuracy.

To evaluate this I changed the dataloader in the PyTorch MNIST example to change the grayscale color to only black and white:

train_loader = torch.utils.data.DataLoader(
    datasets.MNIST('../data', train=True, download=True,
                   transform=transforms.Compose([
                       transforms.ToTensor(),
                       transforms.Normalize((0.1307,), (0.3081,)),
                       lambda x: x>0,
                       lambda x: x.float(),
            ])),
    batch_size=args.batch_size, shuffle=True, **kwargs)
test_loader = torch.utils.data.DataLoader(
    datasets.MNIST('../data', train=False, transform=transforms.Compose([
                       transforms.ToTensor(),
                       transforms.Normalize((0.1307,), (0.3081,)),
                       lambda x: x>0,
                       lambda x: x.float(),
                   ])),
    batch_size=args.test_batch_size, shuffle=True, **kwargs)

The first lambda binarizes the values in every tensor and the second lambda converts the 0s and 1s to float because the inputs have to be float.

To verify if the datareader modification works I plotted image 7777 from both datareaders:

x, _ = test_loader.dataset[7777]
plt.imshow(x.numpy()[0], cmap='gray')
/images/mnist_5_gray.png/images/mnist_5_bicolor.png
After training with the original loader without any modification for 14 epochs the result for the test set is:
Average loss: 0.0289, Accuracy: 9911/10000 (99%).

With the binary modification in the dataloader the results for the test set is only a bit decreased:
Average loss: 0.0374, Accuracy: 9889/10000 (99%).

Either I missed something or the difference isn't that big.