Plot on an OSM map using Python

I want to plot a circle (and later possible a lot of circles) on a static openstreetmap map.
The library best suited seems staticmap from komoot: https://github.com/komoot/staticmap

This code plots a circle on a map of Stuttgart-Vaihingen:

from staticmap import StaticMap, CircleMarker
m = StaticMap(200, 200)

marker = CircleMarker((9.1065541, 48.7324794), '#0036FF', 5)
m.add_marker(marker)

image = m.render(zoom=15)
image.save('marker.png')

I want to generate quite some images on a large map so I added a cache to the tiles system in staticmap: https://github.com/mfa/staticmap/commit/4f922e913d6a3976c645e3b7551af441880763a5

Find and Crop using OpenCV

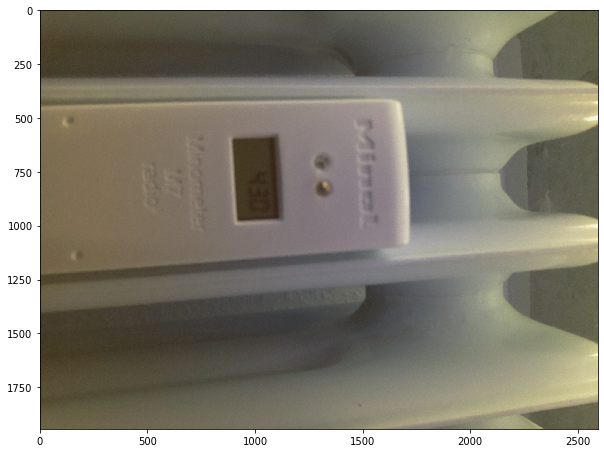
To get the value on a display we first need to crop the display in the image.
This is an example source image:
example_image

The only Python package used is opencv.

Import OpenCV:

import cv2

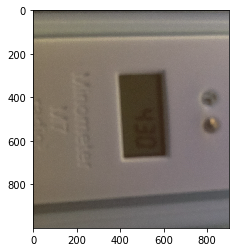
Load image and get middle of image:

image = cv2.imread("../images/1538832301.jpg")
image = image[300:1300, 500:1400]
height, width, channels = image.shape
middle_image

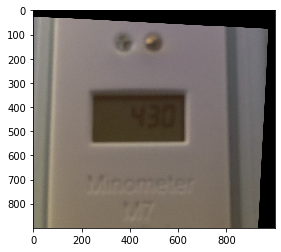
Rotate image:

center = (width / 2, height / 2)
angle = 87
M = cv2.getRotationMatrix2D(center, angle, 1)
image = cv2.warpAffine(image, M, (height, width))
rotated_image

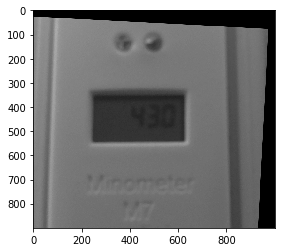
Convert to grayscale:

gray = cv2.cvtColor(image.copy(), cv2.COLOR_BGR2GRAY)
grayscale_image

Blur and threshold:

gray = cv2.blur(gray, (11, 11))
thresh = cv2.threshold(gray, 60, 255, cv2.THRESH_BINARY)[1]
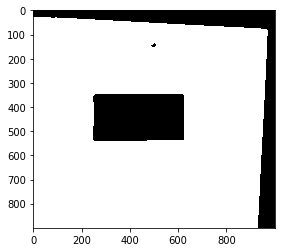
thresh_image

Find contour of box in the middle of the image and plot in green on image. The box has a minimum of 100 pixel width and a minimum of 50 pixel height.

contours,hierarchy = cv2.findContours(thresh, 1, 2)
for cnt in contours:
    x,y,w,h = cv2.boundingRect(cnt)
    if w>100 and h>50:
        break
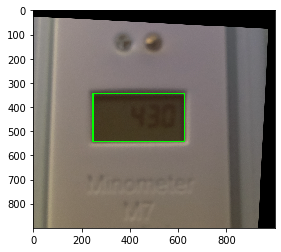
box_image

Now crop image based on the points of the green box:

cropped = image[y:y+h, x:x+w]
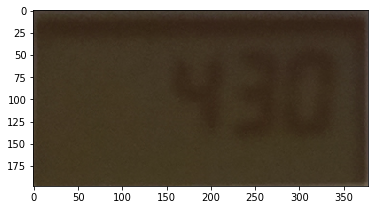
cropped_image

Increase alpha contrast of the image to see the digits and save result to disk:

contrast = cv2.convertScaleAbs(cropped, alpha=3, beta=0)
cv2.imwrite('cropped_image.png', cropped)
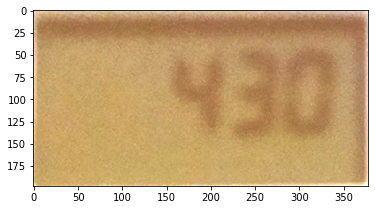
result_image

The next step will be to recognize the numbers in the display.

Get GPS data from images

I wanted to extract the gps coordinates of jpg images. I found this solution and modified it for my needs: https://gist.github.com/snakeye/fdc372dbf11370fe29eb

Requires: exifread

import sys
import exifread

def convert_to_degress(value):
    d = float(value.values[0].num) / float(value.values[0].den)
    m = float(value.values[1].num) / float(value.values[1].den)
    s = float(value.values[2].num) / float(value.values[2].den)

    return d + (m / 60.0) + (s / 3600.0)

def get_location(exif_data):
    latitude = exif_data.get('GPS GPSLatitude')
    latitude_ref = exif_data.get('GPS GPSLatitudeRef')
    longitude = exif_data.get('GPS GPSLongitude')
    longitude_ref = exif_data.get('GPS GPSLongitudeRef')

    if not (latitude and latitude_ref and longitude and longitude_ref):
        return None, None

    lat = convert_to_degress(latitude)
    if latitude_ref.values[0] != 'N':
        lat = 0 - lat

    lon = convert_to_degress(longitude)
    if longitude_ref.values[0] != 'E':
        lon = 0 - lon

    return lat, lon

with open(sys.argv[1], 'rb') as f:
    exif_tags = exifread.process_file(f)
lat, long = get_location(exif_tags)
print(lat, long)

This code reads a JPG image and prints latitude and longitude in decimals of that image.