Using a cli tool and datasette to monitor eye drop frequency
Since working fulltime at home my eyes tend to get dry. The doctor showed me the best drops to use and of course I wanted to monitor how much I need.
To monitor the usage I wrote a cli app to track every time I put a drop into my eyes. This app is called augentropfen and the sourcecode is of course on Github.
The data is written into an csv file because there was no need for something more complicated.
Most of the time the command to call is only python at.py for which I have an alias with the correct path to Python inside a virtualenv.
But there are commandline options to set the date or the time explicit if an eye drop happened further in the past.
Now I wanted to analyse the data -- and here comes sqlite-utils and datasette for the rescue. Converting the simple csv file to a sqlite database and run with datasette:
sqlite-utils create-database eye-drops.db
sqlite-utils insert eye-drops.db data augentropfen.data --csv
# run
datasette eye-drops.db
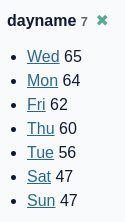
Some prior analysis showed me that I don't drop as often on weekends which is probably because I am more outside on Saturday and Sunday. This question can easily answered with a facet:
But the most interesting is how the frequency of eye droppings changed over time. Do I need more drops in the winter when heating drops the humidity in the room?
So first I needed a query to bucket all datasets into weeks:
SELECT count(*) as drops_applied, strftime('%W', date_rolling) AS week, strftime('%m', date_rolling) AS month, strftime('%Y', date_rolling) AS year
FROM data
GROUP BY strftime('%W', date_rolling), strftime('%Y', date_rolling) ORDER BY drops_applied DESC;
The date date_rolling is changing for the next day not at midnight but at 5am.
This was added to be sure that the regular sleep at night is splitting the dataset days.
The resulting table didn't help much answering the questions because the weeks on top where the weeks I started using the drops and then there was no real regularity.
So maybe we need a plot. Installing datasette-vega.
For the plot I needed another column with week and year in the same column.
The now changed query:
SELECT count(*) as drops_applied, strftime('%W', date_rolling) AS week, strftime('%m', date_rolling) AS month, strftime('%Y', date_rolling) AS year, strftime('%Y-%W', date_rolling) AS year_week
FROM data
GROUP BY strftime('%W', date_rolling), strftime('%Y', date_rolling);
The resulting plot gives quite some insight:
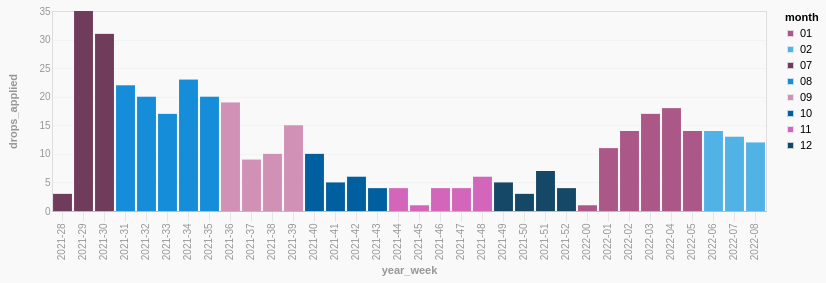
Directly after visiting the doctor I used the drops a lot to heal my eyes. In autumn the usage dropped because the eyes got better and in late winter with the heating and low humidity the usage increased.
Of course I have a monitoring of my humidity in the room using BME280 sensors. Additionally I track my heating consumption using a raspberry pi with a camera and some image recognition. Some time in the future I will combine all this to correlate heating, humidity and eye drops in one graph. But not today.