Draw Geo Points on Shapes
How to draw points on a shapefile? As an example we will do this with Germany and draw a few example cities with the correct location into the shape.
First download the shapefile for Germany from arcgis <https://hub.arcgis.com/datasets/esri-de-content::bundesl%C3%A4nder-2021-mit-einwohnerzahl/about>_ and unpack the zip-file. The file needed here is "LAN_ew_21.shp". There are of course a lot of different possibilites to get a shp file or a GeoJson version of the state borders of Germany.
The following code to plot a few cities onto the Germany shape is using geopandas and matplotlib.
import json
from io import StringIO

import geopandas
import matplotlib.pyplot as plt

states = geopandas.read_file("LAN_ew_21.shp")
# base layer
base = states.plot(color="white", edgecolor="black")
base.set_axis_off()
# some random cities
cities = geopandas.read_file(
    StringIO(
        json.dumps(
            {
                "type": "FeatureCollection",
                "features": [
                    {
                        "type": "Feature",
                        "geometry": {"type": "Point", "coordinates": [7.85, 47.995]},
                        "properties": {"name": "Freiburg im Breisgau"},
                    },
                    {
                        "type": "Feature",
                        "geometry": {"type": "Point", "coordinates": [9.738611, 52.374444]},
                        "properties": {"name": "Hanover"},
                    },
                    {
                        "type": "Feature",
                        "geometry": {"type": "Point", "coordinates": [13.74, 51.05]},
                        "properties": {"name": "Dresden"},
                    }]})))

# plot shape and cities into same plot
fig, ax = plt.subplots()
ax.set_axis_off()
states.plot(ax=ax, color='white', edgecolor='black')
cities.plot(ax=ax, marker='o', color='red', markersize=7)

plt.savefig("plot.png")
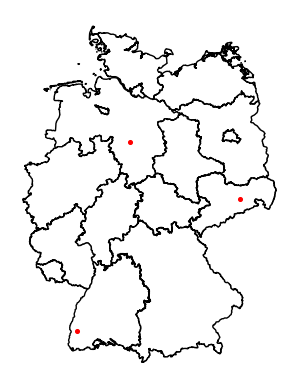
The resulting plot: