PyTorch / Torchvision Learnings

As part of our machine learning user group workshops I learned a few things about PyTorch and torchvision.

This post describes some of them.

To crop images as part of the transform step I wanted to use the functional transforms. This is how I used them as a class in a transform.Compose:

class CustomCropTransform:
    def __call__(self, img):
        return torchvision.transforms.functional.crop(img, top=0, left=0, height=75, width=133)

transforms = torchvision.transforms.Compose([
    torchvision.transforms.Resize(100),
    CustomCropTransform(),
    torchvision.transforms.ToTensor()
])

# example of usage
train_dataset = torchvision.datasets.ImageFolder("train", transform=transforms)

Here the image is first resized to 100x133 and then the bottom 25 pixels got removed by the CustomCropTransform

The second learning was about WeightedRandomSampler. This is useful if the classes in your training dataset are not the same number of items.

from torch.utils.data.sampler import WeightedRandomSampler
import numpy as np

# get targets of all train_datasets
train_targets = [target for _, target in train_dataset]

# use bincount from numpy to count the number of items in each class
counts = np.bincount(train_targets)

# get the weight for each class. this returns a matrix of weights
weight = 1. / counts

# now weight all the training items
train_samples_weight = torch.tensor([weight[t] for t in train_targets])

# use the weights. replacement=True allows using of samples more than once
train_sampler = WeightedRandomSampler(train_samples_weight, len(train_targets), replacement=True)

# now use the train_sampler in the dataloader
train_dataloader = torch.utils.data.DataLoader(train_dataset, batch_size=16, sampler=train_sampler)

The workshop series consists of problem driven walkthroughs: https://github.com/mlugs/machine-learning-workshop

Compare Image Labellers Votes

After using the image labeller tool with more labellers than only me, there was a need to compare the resulting yaml files.

The image labeller is a pygame-based tool to show images and add boolean based labels to the images. This is all described in this blogpost: https://madflex.de/image-tagging/.

To compare the files I wrote a script to reads the tags.yml from every labeller and exports a csv that looks like this:

screenshot

The screenshot is from a csv file uploaded to Github for easier preview.

But the actually interesting things are easier to query/generate on the shell:

# sum of how many blurred/not_blurred we agreed on with a majority
cat comparison.csv | grep -e ".*,True" | cut -d"," -f 8 | sort | uniq -c

# create train/test folders
mkdir -p {train,test}/{blurred,not_blurred}

# generate script to copy majority voted files to their train folder
#                     get only this cols    only non-test imgs  only majority=True   only col 1,3
cat comparison.csv | cut -d"," -f1,2,8,9 | grep "JPG,False" | grep "blurred,True" | cut -d"," -f1,3 | awk -F "," '{ print "cp " $1 " train/"$2 }' > run.sh

# run the generated script
sh run.sh

# and test files based only on majority decision (for all test images)
#                     get only this cols  only test imgs
cat comparison.csv | cut -d"," -f1,2,8 | grep "JPG,True" | awk -F "," '{ print "cp " $1 " test/"$3 }' > run.sh

# run the generated script
sh run.sh

The code of the comparison script is in the image-tagger repository: https://github.com/mfa/image-tagger/blob/main/compare_tags.py.

Using a cli tool and datasette to monitor eye drop frequency

Since working fulltime at home my eyes tend to get dry. The doctor showed me the best drops to use and of course I wanted to monitor how much I need.

To monitor the usage I wrote a cli app to track every time I put a drop into my eyes. This app is called augentropfen and the sourcecode is of course on Github.

The data is written into an csv file because there was no need for something more complicated. Most of the time the command to call is only python at.py for which I have an alias with the correct path to Python inside a virtualenv. But there are commandline options to set the date or the time explicit if an eye drop happened further in the past.

Now I wanted to analyse the data -- and here comes sqlite-utils and datasette for the rescue. Converting the simple csv file to a sqlite database and run with datasette:

sqlite-utils create-database eye-drops.db
sqlite-utils insert eye-drops.db data augentropfen.data --csv
# run
datasette eye-drops.db

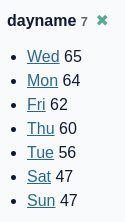
Some prior analysis showed me that I don't drop as often on weekends which is probably because I am more outside on Saturday and Sunday. This question can easily answered with a facet:

screenshot of days of eye droppings

But the most interesting is how the frequency of eye droppings changed over time. Do I need more drops in the winter when heating drops the humidity in the room?

So first I needed a query to bucket all datasets into weeks:

SELECT count(*) as drops_applied, strftime('%W', date_rolling) AS week, strftime('%m', date_rolling) AS month, strftime('%Y', date_rolling) AS year
FROM data
GROUP BY strftime('%W', date_rolling), strftime('%Y', date_rolling) ORDER BY drops_applied DESC;

The date date_rolling is changing for the next day not at midnight but at 5am. This was added to be sure that the regular sleep at night is splitting the dataset days. The resulting table didn't help much answering the questions because the weeks on top where the weeks I started using the drops and then there was no real regularity.

So maybe we need a plot. Installing datasette-vega. For the plot I needed another column with week and year in the same column. The now changed query:

SELECT count(*) as drops_applied, strftime('%W', date_rolling) AS week, strftime('%m', date_rolling) AS month, strftime('%Y', date_rolling) AS year, strftime('%Y-%W', date_rolling) AS year_week
FROM data
GROUP BY strftime('%W', date_rolling), strftime('%Y', date_rolling);

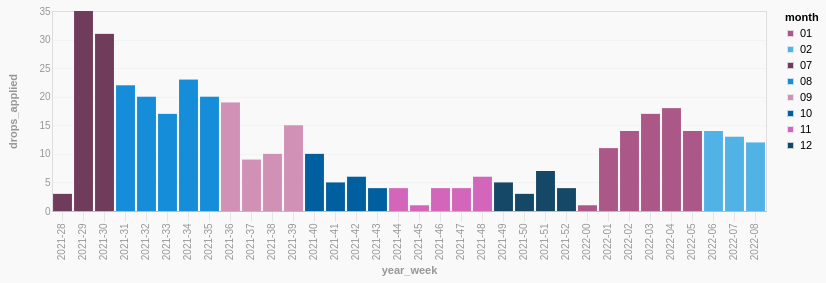
The resulting plot gives quite some insight:

visualization of eye drop usage by weeks

Directly after visiting the doctor I used the drops a lot to heal my eyes. In autumn the usage dropped because the eyes got better and in late winter with the heating and low humidity the usage increased.

Of course I have a monitoring of my humidity in the room using BME280 sensors. Additionally I track my heating consumption using a raspberry pi with a camera and some image recognition. Some time in the future I will combine all this to correlate heating, humidity and eye drops in one graph. But not today.