Spa towns near Rivers

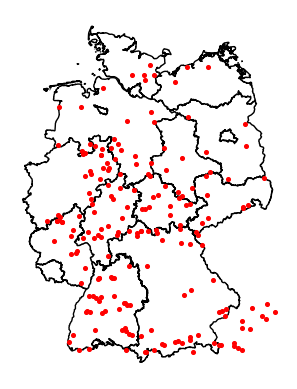
As followup to the previous post, I was asked if spa towns are near rivers. Let's see if we can answer this by using overpass, shapely and geopandas.

In the previous blog post I used a bounding box to get all spa towns in Germany. There is a better way by using area ids queried via Nominatim. For Example select all rivers in Germany this way:

from OSMPythonTools import overpass
from OSMPythonTools.nominatim import Nominatim

nominatim = Nominatim()
# get areaId for Germany
area_id = nominatim.query("Germany").areaId()

api = overpass.Overpass()
query = overpass.overpassQueryBuilder(
    # use area_id instead of bbox
    area=area_id,
    # some rivers are relations
    elementType=["way", "relation"],
    # only natural rivers
    selector='"natural"="water"',
    out="body",
    includeGeometry=True,
)
result = api.query(query, timeout=300)

# write to json
json.dump(result.toJSON()["elements"], open("rivers.json", "w"), indent=2, ensure_ascii=False)

The selector is "natural=water", more information about waterways in the openstreetmap wiki. This query will take a bit of time to run and writes a lot of files in the cache folder. To count the datasets we could use jq:

jq '.[].id' rivers.json | wc -l
# returns: 403851

A lot of natural waterways!

For testing I selected the first 3 rivers and wrote them into an extra file to speed up development of the following Python code:

jq '.[0:2]' rivers.json > 3rivers.json

Next calculate the distance between every river and every spa town. We have latitude/longitude from Openstreetmap and can calculate which river is the nearest, but the resulting values are the euclidian distance (and not in meters).

The following code is a non-optimized brute-force approach and would be a lot faster by limiting the rivers with their bounding boxes. But for now start with the least code possible.

import json

import geopandas as gpd
from shapely import LineString, Point, Polygon
from tqdm import tqdm


# loading spas
def _spas():
    for d in json.load(open("spa_towns.json")):
        yield {
            "id": d["id"],
            "name": d.get("tags", {}).get("name", f"--{d['id']}"),
            "geometry": Point(d["lat"], d["lon"]),
        }


df = gpd.GeoDataFrame.from_records(_spas())

print("loading rivers")
rivers = json.load(open("rivers.json"))


def get_nearest(row):
    print(row["name"])
    shortest_distance = 100
    nearest_river = None
    for river in tqdm(rivers):
        # filter everything that has no wikidata entry
        if river.get("tags", {}).get("wikidata") is None:
            continue

        river_name = river.get("tags", {}).get("name", f"noname-{river['id']}")

        if river.get("type") == "way":
            ways = [river]
        elif river.get("type") == "relation":
            # relations contain more than one way
            ways = river.get("members")
        else:
            # don't calculate anything
            continue

        for way in ways:
            if not way.get("geometry"):
                continue
            d = row["geometry"].distance(
                LineString([(i["lat"], i["lon"]) for i in way.get("geometry")])
            )
            if d < shortest_distance:
                nearest_river = river_name
                shortest_distance = d
    return f"{nearest_river} ({shortest_distance})"


# fill a new column with nearest_river and distance in brackets
df["nearest_river"] = df.apply(lambda row: get_nearest(row), axis=1)
# write data as GeoJson
df.to_file("spa_river.json", driver="GeoJSON")

The code filters on only rivers/lakes with a wikidata entry, to get rid of a lot of "Kneipp-Bad" or "Teich mit Enten" or for Bad Canstatt the "Brillenpinguine" in the local zoo.

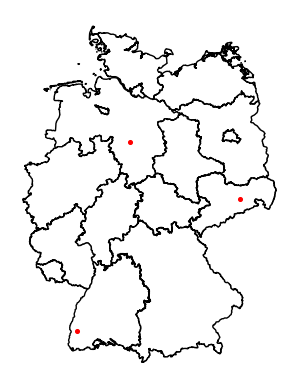
Looking at some of the results:

Bad Wildbad is next to the river "Enz" but the nearest river here is Nagoldtalsperre (0.19372965182449883) which is not that far away, but not the "Enz". The Enz is actually missing because it is not tagged with natural="water". Bad Honnef is next to the "Rhein" (Rhine) but the value we get is Blauer See (0.11373349109158684). Bad Teinach should be next to the river "Nagold", but the value is Gültlinger See (0.09095129123228435).

So the result is not good enough to answer the question if a river is near every spa town. The rivers would have to be manually filtered and maybe even selected beforehand. For automatic selection with only Openstreetmap there is not enough information.

Spa towns starting with "Bad" and OSM

A few days ago I was sitting at a train station in Bad Wildbad waiting for a train home because of a flat tire on my bike. I was thinking about spa town distribution and cities which name starts with "Bad" (German for "bath") which is a pretty solid indicator for a spa town in Germany. Of course there are many spa towns in Germany that don't start with "Bad". Probably they could be collected via a wikidata query on subclass of spa town but I wanted to solve this with Openstreetmap only.

To get the datasets of all cities, towns, villages and suburbs starting with "Bad" we use the same Python code as in a previous blogpost about the overpass api. The changes needed are:

elementType=["node"],
selector=['"name"~"^Bad "', '"place"~"town|village|city|suburb"'],

City names can be in nodes or ways (ways contain the borders of the city). Nodes seem more common so limit to those. The selector "name" should start with "Bad " and "place" should be limited to a list of town-link places. The query with a trailing space will filter out "Baden Baden", but also some false positives, i.e. Badevel, Badonvilliers-Gérauvilliers and a few more.

The query result is messy. A few cities are duplicates (i.e. Bad Salzuflen; Bad Sooden, Bad Sooden-Allendorf - both town vs. suburb). But removing all "suburbs" will remove a lot more valid cities. Without manual work this will not be without error.

Three examples of nodes returned show that the attached tags differ a lot:

First: A way should be used; I ignore them for now. This city will have empty metadata.

{
  "type": "node",
  "id": 25728642,
  "lat": 50.2276774,
  "lon": 9.3485142,
  "tags": {
    "name": "Bad Orb",
    "note": "Alle Daten der Stadt Bad Orb sind in der zugehörigen Grenzrelation. Dieser node dient nur zur Markierung der Ortsmitte.",
    "place": "town"
  }
}

Second: The fields have no prefixes. Kind of what I expected and most cities look like this.

{
  "type": "node",
  "id": 26120920,
  "lat": 51.5911653,
  "lon": 12.5856428,
  "tags": {
    "ele": "98",
    "name": "Bad Düben",
    "place": "town",
    "population": "8000",
    "postal_code": "04849",
    "website": "https://www.bad-dueben.de",
    "wikidata": "Q12041",
    "wikipedia": "de:Bad Düben"
  }
}

Third: A lot of extra fields prefixed with OpenGeoDB. I ignore this fields and hope the other fields are filled good enough.

{
  "type": "node",
  "id": 21635999,
  "lat": 47.5062921,
  "lon": 10.3699251,
  "tags": {
    "ele": "825",
    "name": "Bad Hindelang",
    "openGeoDB:community_identification_number": "09780123",
    "openGeoDB:is_in_loc_id": "270",
    "openGeoDB:layer": "6",
    "openGeoDB:license_plate_code": "OA",
    "openGeoDB:loc_id": "13927",
    "openGeoDB:telephone_area_code": "08324",
    "place": "town",
    "population": "4899",
    "postal_code": "87541",
    "wikidata": "Q522573",
    "wikipedia": "de:Bad Hindelang"
  }
}

The resulting list of elements is then converted into a Pandas Dataframe:

df = pd.DataFrame.from_records(
    [
        # all fields, excluding "tags"
        {k:v for k, v in d.items() if k != "tags"}
        # merge tags to toplevel
        | {k: v for k, v in d["tags"].items()}
        for d in data
    ]
)

Next we want to find out which tags are mostly filled:

# sum emptiness of fields; subtract from number of rows and sort by highest number
print(
    dict(
        pd.isna(df)
        .sum(axis=0)
        .apply(lambda x: len(df) - x)
        .sort_values(ascending=False)
    )
)

The most common ones are as expected the essential parts of the query:

"place": 237,
"name": 237,
"lon": 237,
"lat": 237,
"id": 237,
"type": 237,
"population": 165,
"wikidata": 158,
"wikipedia": 124,
"postal_code": 62,

From 237 datasets 158 datasets have a link to Wikidata and 124 one to Wikipedia. And even less have a postal_code. One could argue that this information could be found elsewhere. But it would be convenient to have the population filled or a wikidata link to query more information.

Finally lets use the code from the previous blogpost to plot all the spa cities starting with "Bad " on a Germany map. As seen on the plot, some spa cities are in Austria or in Switzerland because the bounding box used in the query is a rectangle and not the exact borders of Germany.

3 example cities plotted into German state borders

Draw Geo Points into a Shape

How to draw points on a shapefile? As an example we will do this with Germany and draw a few example cities with the correct location into the shape.

First download the shapefile for Germany from arcgis and unpack the zip-file. The file needed here is "LAN_ew_21.shp". There are of course a lot of different possibilities to get a shp file or a GeoJson version of the state borders of Germany. Feel free to try others.

The following code plots a few cities onto the Germany shape by using geopandas and matplotlib.

import json
from io import StringIO

import geopandas
import matplotlib.pyplot as plt

states = geopandas.read_file("LAN_ew_21.shp")
# some random cities as GeoJSON
cities = geopandas.read_file(
    StringIO(
        json.dumps(
            {
                "type": "FeatureCollection",
                "features": [
                    {
                        "type": "Feature",
                        "geometry": {"type": "Point", "coordinates": [7.85, 47.995]},
                        "properties": {"name": "Freiburg im Breisgau"},
                    },
                    {
                        "type": "Feature",
                        "geometry": {"type": "Point", "coordinates": [9.738611, 52.374444]},
                        "properties": {"name": "Hanover"},
                    },
                    {
                        "type": "Feature",
                        "geometry": {"type": "Point", "coordinates": [13.74, 51.05]},
                        "properties": {"name": "Dresden"},
                    }]})))

# plot shape and cities into same plot
fig, ax = plt.subplots()
ax.set_axis_off()
states.plot(ax=ax, color="white", edgecolor="black")
cities.plot(ax=ax, marker="o", color="red", markersize=7)

plt.savefig("plot.png", bbox_inches="tight")

The resulting plot:

3 example cities plotted into German state borders